The daily carbon footprint of dairy goats was reduced in 0.26 kg carbon dioxide equivalents when goats were fed diets with lower levels of crude protein. There were no differences in production of carbon dioxide eq when this amount was expressed per kg of milk.
Objective
The aim of this trial is to reduce the protein content of dairy goat diets in order to decrease the excretion of N in faeces and urine.
Materials and Methods
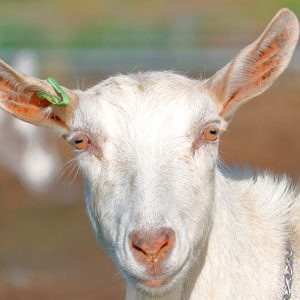
Figure 1. Dairy goat of the breed Murciano-Granadina
Animals
Goats from the Murciano-Granadina breed were used as a model for ruminant animals during the mid-lactation period (43 kg average live weight).
Housing
The facilities belong to the Polytechnic University of Valencia.
Metabolic cages were used to establish the nitrogen balance and to quantify the nitrogen ingested, excreted in faeces and urine, and retained in the body and milk.
To determine the in vivo gas emissions in each animal, an open circuit indirect calorimetry system described by Fernández et al. was used (2012; 2015).
Experimental design
Mixed rations were prepared in a concentrated fodder ratio of 40/60, the fodder being alfalfa hay.
One of the rations had 19% crude protein (CP) and the other one had 15% CP.
40 goats were fed with the high-CP diet and 65 goats were fed with the low-protein diet.
Results
The greenhouse gases (nitrous oxide [N2O], carbon dioxide [CO2] and methane [CH4]), expressed in CO2 equivalents, are presented in Table 1.
The N2 was estimated according to HACCP, 2006.
Table 1. Carbon footprint of dairy goats fed different levels of crude protein (CP)
A lower emission, expressed in kg of CO2 eq, coming from the CO2 and N2O gases was associated to the low CP ration. This reduction in gases was not followed by a reduction in CH4 gas.
Regarding the CO2 eq originating from methane, a possible explanation would be the high fibre content of the low-CP ration.
The kg of CO2 eq per goat per day was lower in the low-CP ration (1.91 vs. 2.17), and if we express this amount per kg of milk, no differences are observed between the diets (1.0 kg CO2 eq/kg milk, on average).
Conclusions
The reduction of the CP of the ration by 4 points led to a reduction of 0.26 kg of CO2 eq per goat per day.
The present study is a theoretical approximation with values determined in the trial conditions and using the individual goat as a model.
In other words, the herd and the type of farm have not been evaluated and therefore do not include emissions from t...


