
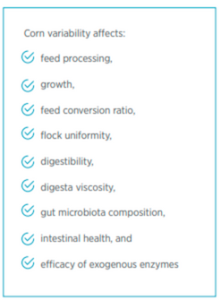
Understanding corn variability
Corn is the most common feed ingredient used in poultry nutrition worldwide. Consequently, it is the most common physical and biochemical factor affecting the bird’s intestines after drinking water.
- Maize contributes with up to 65% of the metabolizable energy and 20% of crude protein in poultry diets.
- Its average nutritional value is well known, but the variability in its energy value is a very common issue with a great impact on poultry performance and health.
Variability in corn composition (understanding what it implies)
In animal nutrition, yellow dent corn tends to be categorized by:
- Test weight per bushel
- Physical appearance
- Crude protein content
- Proximate analyses are used to
estimate its energy values
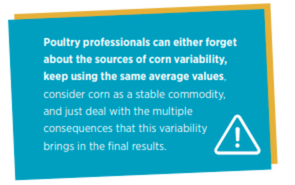
An alternative pathway is establishing a better understanding of the parameters affected for each factor, determine key indicators, measure them, and generate strategies in corn production and processing that minimize the variability.
We intend to contribute to spreading the understanding of corn variability.
This first article on this topic will address recent advances in understanding the:
- Variability in corn composition
- Physicochemical properties
- Effects of thermal processing in corn
grinding
This information was partially presented at the Arkansas Nutrition Conference in September 2021.
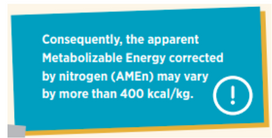
However, the accuracy of estimating those energy values for feed formulation is not always satisfactory due to the:
- Variability in nutrient and antinutrient
content - The grain’s physical properties
- The interactions among these factors
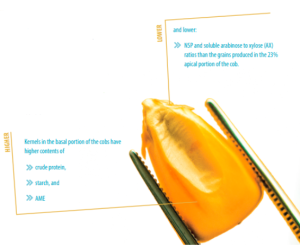
Variability is part of nature, and there is an inevitable proportion impossible to control. For example, recently, Diego Melo Duran, in his Ph.D. dissertation from the Autonomous University of Barcelona in Spain, concluded that:
“The position of the kernel in the cob cause variation in the nutrient and non-starch polysaccharides (NSP) content of the grain.”
The content of all nutrients or their availability to generate energy could be variable in corn depending on:
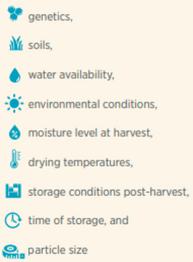
- This effect of position in the cob varies with genetic varieties. The genotype and the location of the plantation also interact, generating more variation in all nutrient composition.
- However, NSP has great variability among maize genotypes.
In Dr. Melo Duran’s studies, the:
- Total NSP ranged from 55.6-81.3 g/kg
- Soluble NSP ranged from 1.0 to 8.5 g/kg
- Total AX ranged from 38.8 to 50.0 g/kg
- Soluble AX ranged from 2.2 to 5.3 g/kg
The soluble AX of some maize varieties could be similar to wheat promoting digesta and excreta viscosity issues. On the other hand, some corn varieties have less nutrient and NSP content variability.
Consequently, a long-term goal could be to use corn breeding and genetic selection to minimize this variability in corn nutritional value.
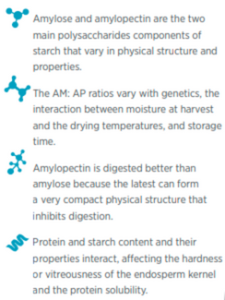
The variation in corn crude protein is close to 5 percentage points from 8 to 13%, but more important is the variation in zein content, the main corn protein.
The starch content variability is around 2%,but the final amylose to amylopectin ratio (AM:AP) may play a bigger role in energy and nutrient availability.
Variability in physico-chemical properties of corn
Maize vitreousness, the ratio of hard to soft endosperm, is related to starch properties and zein content and highly correlated (r = 0.87) with kernel density and, consequently, with corn harvest yields.
- More vitreous corn has higher amylose and zein content, and its starch granules are smaller and circular.
However, the zein content and its interactions with starch contribute more to vitreousness properties than starch molecular properties.
- Corn with high vitreousness generally has 20 to 30% higher phytate content.
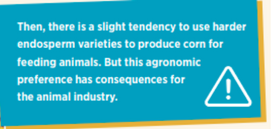
- High vitreousness is correlated with reduced nutritional value for poultry. But the response may vary depending on many factors, especially corn genetics.
- Then vitreousness cannot be considered the best parameter for nutritional quality for poultry but plays a role in
nutrient quality.
Another marker of corn nutritional value is the extractable salt-soluble protein content or protein solubility index (PSI) in 0.5M NaCl.
This test is a laboratory methodology used in France and many parts of the world to evaluate corn quality.
The standard French Promatest method NF-V03-741 (AFNOR, 2008) can be used to determine PSI, and these values can be estimated with NIRS.
- The PSI varies 20% among corn samples from different locations.
- Dr. Melo-Duran (2021) indicated a high (r =0.83) positive
correlation between PSI and AME predicted by NIRS. - The thermal denaturation of corn proteins reduces the PSI,
especially when harvested at high moisture.
Effects of thermal processing in corn variability
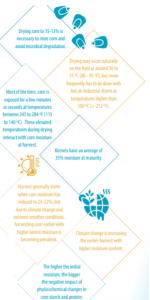
Our studies at NC State University have indicated that drying corn at 120 oC can cause more amylose within starch (25.5%) than drying at 35 oC (21.5%) and increases the starch gelatinization linearly without observing significant differences among the drying temperatures evaluated.
- The increment in amylose content due to high drying temperature (120 oC) in hard endosperm
kernels was twice (21.3 to 26.7%) as much as the one observed in kernels with average endosperm (21.7 to 24.2 %).
The previous observations are just a few of the multiple impacts of drying temperatures in corn of different kernel hardness.
In experiments conducted in my lab, we concluded that:
Hot air-drying at either 80 or 120 oC decreased:
- Vitreousness
- PSI
- Increased damaged starch
- Total and insoluble NSP
- Total and insoluble arabinoxylans
- Increasing the AX compared to drying at
35 oC in a commercial corn hybrid with
lower vitreousness (61.98 %)
However, when corn kernels with harder endosperm (63.61% vitreousness) were dried, no changes in vitreousness, PSI, and NSPs due to drying temperature were observed.
In the harder endosperm, higher drying temperatures decreased the content of damaged starch and increased the AX compared to drying at 35 oC.
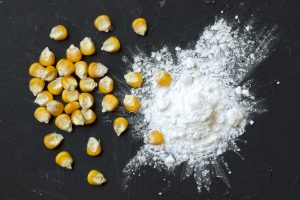
Damaged starch is a valuable parameter for assessing the quality of flours.
- It refers to the portion of kernel starch that has been physically broken or fragmented during wheat milling making it more susceptible to digestion.
- Damaged starch increases water absorption capacity and susceptibility to erosion by endogenous alfa-amylase, ultimately increasing starch digestion.
- The changes observed in chemical components had effects on the breakage susceptibility of corn kernels during harvest and grinding at the feed mill.
We observed interactive effects of corn variety and drying temperature on:
- the geometric mean of particle size (dgw) (Figure 1) and in its distribution or variability expressed as the standard deviation of the particle size (Sgw) (Figure 2) after milling in a hammer and roller grinders.
- The dgw was positively correlated (r = 0.69) with amylopectin and negatively correlated with AM:AP (r = -0.68) and damaged starch (r = – 0.65).
On the other side, the storage time decreased:
- the dgw, because some biochemical changes occur during storage.
- additionally, the pellet durability index was better for diets with average kernel hardness and corn dried at 35oC than higher temperatures.
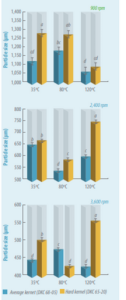
Figure 1. Effect of kernel hardness and drying temperature on
particle size (Dgw) in a hammermill at 12-12 screen (4.76 mm)
with 900, 2,400, and 3,600 rpm (NC State University research)
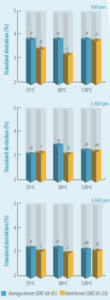
Figure 2. Effect of kernel hardness and drying temperature on standard deviation (Sgw) in hammermill at 12-12 screen (4.76 mm, US mesh 4) at 900, 2,400, and 3,600 rpm (NC State University research).
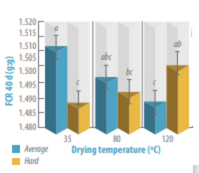
Figure 3. Effect of corn kernel hardness (average and hard) and drying temperature (35, 80, and 120 oC) on FCR at 40 d. Means not sharing a common superscript (a-c) are significantly different (n=8; P < 0.01) by Tukey’s test (NC State University research)
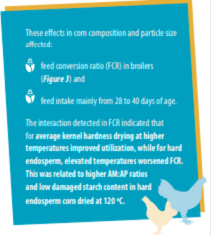
In the next article, we will discuss in more detail these impacts on energy value for poultry, non-starch polysaccharide content, proposals to determine the best quality corn, and how to control its variability better.
Source: Written by Edgar Orlando Oviedo-Rondón *Prestage Department of Poultry Science, North Carolina State University, Raleigh, NC Corresponding Author: [email protected]