


Global Agriculture Outlook 2025/26: USDA Projects Record Crops and Shifting Trade Dynamics
The USDA’s latest World Agricultural Supply and Demand Estimates (WASDE) presents a cautiously optimistic global outlook for 2025/26. With projections of record production in several major commodities, the report also highlights evolving export competitiveness, domestic supply dynamics, and forecast uncertainties.


Wheat: Higher Supplies, Lower Prices, and Strong Global Competition
![]()

-
Winter wheat production is projected at 1.382 billion bushels, up 2%, led by Hard Red Winter and White wheat varieties.
-
Domestic use will reach a record 977 million bushels, mostly for food.
-
Exports are projected lower at 800 million bushels, due to “strong competition from most major exporters.”
-
Ending stocks are expected to grow to 923 million bushels, the highest in six years.
-
Farm price is forecast at $5.30/bushel, down from $5.50, influenced by abundant corn supplies.
🔍 Forecast Reliability (U.S. Wheat):
-
Production: MSE of 6.8%, 90% CI ±11.5%
-
Exports: Highly volatile, MSE of 11.9%, 90% CI ±20.1%
Corn and Coarse Grains: Record Output with Global Stock Pressures


-
Exports rise to 67.95 million MT, reflecting competitive pricing.
-
Ending stocks increase to 45.73 million MT, the highest since 2019/20.
-
Farm price dips to $4.20/bushel, down $0.15.
🌎 Global corn production is projected at a record 1.265 billion MT, but ending stocks decline to 277.84 million MT.
🔍 Forecast Reliability (U.S. Corn):
-
Production: MSE 14.1%, 90% CI ±23.8%
-
Ending stocks: MSE 66%, CI ±111.2%

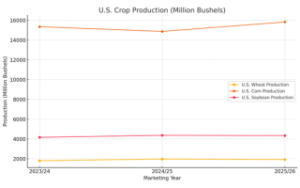
Figure 1.U.S. Crop Production Trends (Million Bushels)
Soybeans: U.S. Share Shrinks Despite Strong Crush Demand
![]()

-
Domestic crush rises to 2.49 billion bushels, supporting growing demand for soybean meal and oil.
-
Exports fall to 1.815 billion bushels, dropping the U.S. share of global soybean trade to 26%.
-
Ending stocks decline to 295 million bushels, while the average farm price rises to $10.25.
🌍 Global soybean production climbs to 426.8 million MT, led by Brazil (175 million MT), offsetting lower output in the U.S. and Argentina.
Rice: Supply Builds on Imports as Prices Fall


-
Ending stocks: Projected at 1.51 million MT.
-
Farm price: Drops to $13.20/cwt, down from $15.20.
Globally, rice production is forecast at 538.71 million MT, nearly matching global consumption. India remains the top exporter, limiting growth for others.
Sugar: Imports Drop, Stocks Tighten in the U.S.
![]()

-
Imports drop sharply to 2.475 million STRV, down from 2.944 million.
-
Ending stocks are projected at 1.436 million STRV, with a stocks-to-use ratio of 11.62%.

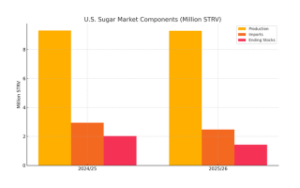
Figure 2. U.S. Sugar Market Components


-
Beef production declines in 2026 due to a ban on cattle imports from Mexico following New World Screwworm detections.
-
Pork and poultry production rise on improved returns.
-
Egg and turkey production rebound post-HPAI outbreaks.
-
Broiler prices continue upward; egg and hog prices are expected to ease.


-
Milk output grows with larger herds.
-
Dairy prices are forecast lower due to oversupply.
-
All-milk price for 2026: $21.15/cwt

Cotton: Slight Production Dip, Steady Demand
Global cotton production is projected at 117.81 million bales, with demand slightly exceeding supply at 118.08 million bales.
-
U.S. production: 14.50 million bales.
-
U.S. exports: 12.50 million bales.
-
Ending stocks: 5.20 million bales.
🔍 Forecast Reliability (Cotton):
-
Global production: MSE 6.0%, 90% CI ±10.0%
Conclusions
The 2025/26 WASDE outlook signals robust agricultural output across major commodities, but also underscores the growing influence of global competition, shifting trade flows, and domestic policy interventions. For U.S. producers, success may increasingly hinge not just on production, but on adaptability in a volatile global market.
Source: USDA