
Nutrient and energy content of synthetic and crystalline amino acids
The utilization of synthetic and crystalline, or non-bound, amino acids is rapidly increasing in the feed industry due to interest in minimizing dietary crude protein and the inclusion of soybean meal or other products that may have a high environmental impact.
The feed amino acid market is estimated at 8.38 billion US dollars in 2025. It is expected to reach 10.71 billion US dollars by 2030, growing at a compound annual growth rate of 5%.
Non-bound amino acids accounted for 22.1% of the global feed additives market value in 2022. The growing emphasis on precision animal nutrition has led to increased investment in research and development, resulting in more efficient amino acid formulations and application methods.
The development of new fermentation technologies and improved extraction methods have resulted in higher purity levels and better bioavailability of amino acids in animal feed. These technological advancements have also reduced production costs, making amino acid supplementation more accessible.
Nowadays, not only lysine, methionine, threonine, valine, and tryptophan but also arginine, glutamine, and isoleucine are commonly included in feeds. The sources of these amino acids are highly variable due to the form and concentration in which they are produced.
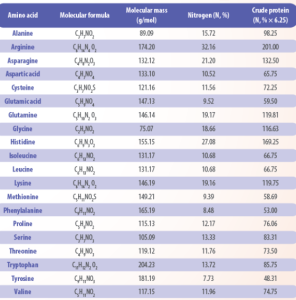
Their molecular formula can determine the nitrogen content of pure (100%) amino acids. The historical conversion factor for calculating crude protein from the nitrogen percentage is 6.25. This is based upon a typical protein containing 16% nitrogen. However, it has been shown that the 6.25 factor is incorrect for most all feed ingredients.
The nitrogen content on a 100% potency for 20 amino acids on a dry matter basis is shown in Table 1. It is typically not 16%, averaging only 14.74% if each amino acid monomer was only represented once in a given protein. So, the appropriate nitrogen correction factor for any given amino acid or protein is not 6.25.
Table 1. Molecular formula, molecular mass, nitrogen content, and calculated crude protein using the 6.25 factor of 20 amino acids, considering them 100% pure and values are on a dry matter basis.
The amino acid sources available in the poultry industry are not pure. All feed amino acids available vary in their final composition, and nutritionists should consider this variation in their formulation matrix.
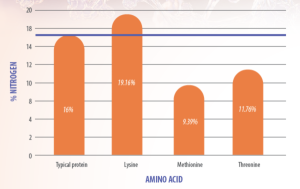
Figure 1. Nitrogen content in non-bound limiting amino acids of poultry.
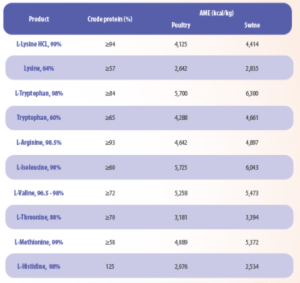
Amino acids contain energy, and their specific value has been estimated or determined in experiments with poultry and swine. Table 2 presents some values reported for 100% pure amino acids. However, feed amino acids may vary depending on the provider and concentration.
Table 2. N-corrected Apparent Metabolizable Energy (AMEn, kcal/kg) for 20 amino acids.1
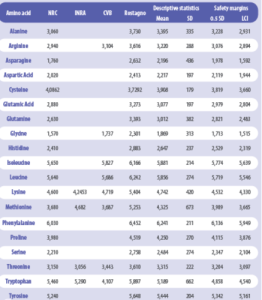
1100% pure (USP) amino acids on a dry matter basis. 2Reported as Cystine. 3Converted from hydrogen chloride form. 4Safety Margin: 0.5 SD = (Mean–0.5 x SD). 5Safety Margin: LCI = 95% lower confidence interval (Mean–1.96 x SD/SQRT(n)). NRC. 1994. Nutrient requirements of poultry. 9th rev. ed. Natl. Acad. Press, Washington, DC. INRA. 2004. Tables of composition and nutritional value of feed materials. Pages 297 in Sauvant, D., J. M. Perez, and G. Tran eds. Wageningen Academic Publishers The Netherlands & INRA Paris, France. CVB. 2023. Feed Table–Chemical composition and nutritional values of feedstuffs. Accessed Feb 7, 2025. https://www.cvbdiervoeding.nl/pagina/10081/downloads.aspx 709 pages. Rostagno, H. S., L. F. T. Albino, A. A. Calderano, M. I. Hannas, N. K. Sakomura, F. G. Perazzo, G. C. Rocha, A. Saraiva, M. L. Teixeira de Abreu, J. Luiz Genova, and F. de Castro Tavernari. 2024. Brazilian tables for poultry and swine. Composition of feedstuffs and nutritional requirements. 5th ed. Viçosa: UFV.
Tables 3 and 4 summarize the nutrient and energy values reported by several suppliers for their diverse amino acid products. Nutritionists should consider these differences to matrix each product correctly. The accuracy in these values may contribute to improving precision in feed formulation.
Table 3. Crude protein, digestible methionine equivalent, and energy content of amino acids distributed by Adisseo https://www.adisseo.com/en/, Evonik https://animal-nutrition.evonik.com/en/products-and-solutions/amino-acids and NOVUS International https://www.novusint.com/methionine/

1 Methionine Hydroxy-analogue 2 Digestible energy swine 4,699 kcal/kg. Sulfur 19%. 3 Dry matter 98.2%, phosphorus 0.13%, additional amino acids of the biomass: Methionine 0.08%, cysteine 0.04%, Methionine + Cystine 0.12%, Threonine 0.24%, Tryptophan 0.02%; Arginine 0.61%, Isoleucine 0.24%, Leucine 0.50%, Valine 0.33%. Digestible energy swine 4,230 kcal/kg and 18.07 MJ/kg. 4 Digestibility 100.0%. 5 Digestibility 100%, Digestible energy swine 4,030 kcal/kg or 16.9 MJ/kg. 6 Digestibility 1005; Digestible energy swine 6,540 kcal/kg or 27.4 MJ/kg.
Table 4. Crude protein and energy content of amino acids distributed by CJ Bio. https://cjbio.net/en/products/bestamino