


Nutritional characterization of peas (Pisum sativum) for poultry feeding and effect of microwave deactivation.
Feed impacts 55% of total poultry production costs (Nahara, 2018).

Currently, this sector faces a new and challenging scenario: the increase in the price of traditional ingredients.
Internationally, corn and soybeans showed a price increase of 88% and 57% in the last 24 months, respectively (IndexMundi, 2022).
This price increase has created the need to look for alternative ingredients in order to reduce production costs.
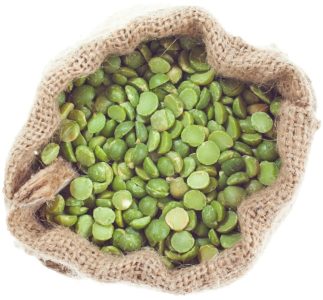
Peas, (Pisum sativum)represent a viable alternative to be used as a replacement for conventional ingredients in animal feed. Argentina’s INASE (National Seed Institute, 2022) has more than 87 registered varieties that can be green or yellow.
![]()
The most common cultivars in Argentina, are: Viper (green peas) and Yams (yellow peas) (Prieto, 2009).
Pea grains have the potential to be considered as ingredients for animal feed. These are characterized by:
![]() High crude protein content (20-26%)
High crude protein content (20-26%)
![]() Good palatability
Good palatability
![]() Low content of antinutritional factors (Galméus, 2012; de Blas et al. , 2019).
Low content of antinutritional factors (Galméus, 2012; de Blas et al. , 2019).
Their protein content is mainly composed of albumins and globulins. They are deficient in sulfur amino acids and tryptophan, but rich in lysine.
![]() The digestibility of protein and amino acids is similar to that of soybean meal. They have a low fat content and a high starch content (42-51%) (de Blas et al., 2019).
The digestibility of protein and amino acids is similar to that of soybean meal. They have a low fat content and a high starch content (42-51%) (de Blas et al., 2019).
Generally speaking, legumes are characterized by the presence of anti-nutritional factors, such as:
![]() Trypsin inhibitors
Trypsin inhibitors
![]() Phyto-hemaglutinins
Phyto-hemaglutinins
![]() Cyanogenic glycosides
Cyanogenic glycosides
![]() Saponins
Saponins
![]() Alkaloids
Alkaloids
![]() Non Protein Amino Acids (Cubero & Moreno, 1983; Monari, 1996),which negatively affect the productive performance of birds (Iglesias & Azcona, 2012).
Non Protein Amino Acids (Cubero & Moreno, 1983; Monari, 1996),which negatively affect the productive performance of birds (Iglesias & Azcona, 2012).
Researchers from INTA carried out a study to evaluate the nutritional composition of certain pea varieties.
Objectives
- Characterize the nutritional composition of two different pea cultivars(green and yellow).
- Assess the effects of microwave deactivation.
Materials and methods
Pea samples were taken from the Viper and Yams cultivars, green and yellow respectively, from the 2019 and 2020 campaigns grown in Argentina. The following parameters were determined:
- Dry Matter
- Crude Protein (CP) through the Kjeldahl method
- Ether Extract (EE) extracted through the use of hexane
- Crude Fiber (CF)
- Ashes
- Starch
Neutral detergent fiber (NDF) was also determined through the Goering and Van Soest method (1970), with the addition of α-amylase. Acid detergent fiber (ADF) was determined according to Van Soest methodology(1963).
In addition, urease activity and trypsin inhibitors were measured.

To complement the chemical characterization, true metabolizable energy (TME) was determined (Sibbald, 1976), as well as its nitrogen correction(TMEn), using 6 roosters per sample.
A 200 g sample of raw peas in the form of a monolayer was placed on a microwave dish with a 900 Watts power output. It was cooked at 70% power for different cooking times (0, 3, 5, 6, 7 and 9 min), in 3 batches (repetitions) (Chale et al., 2017) This process was carried out to evaluate the effects of microwave deactivation.
A completely randomized design with 6 treatments and 3 repetitions each was used.
The analyses performed on the sample were:
![]() Dry matter
Dry matter
![]() Crude protein using the Kjeldahl method
Crude protein using the Kjeldahl method
![]() Urease activity (UA)
Urease activity (UA)
![]() Protein solubility (PS)
Protein solubility (PS)
![]() Insoluble nitrogen in acid detergent (INAD)
Insoluble nitrogen in acid detergent (INAD)
![]() True metabolizable energy through the Sibbald method(1976). 3 roosters were used per repetition.
True metabolizable energy through the Sibbald method(1976). 3 roosters were used per repetition.
The data was submitted to analysis of variance (ANOVA). When the degree of significance was less than 5%, the mean comparison was performed through the minimum significant differences test(Di Rienzo et al. , 2020).
Results and discussion
Nutritional composition
Table 1 shows the composition results of Viper and Yams peas from the 2019 and 2020 campaigns, as well as the pea values published on FEDNA tables (de Blas et al. , 2019).
Table 1. Treatments.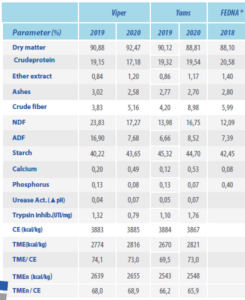 Table 1. Data standardized to 88% DM, except dry matter. GE: Gross energy; TME, True metabolizable energy; TMEn: True metabolizable energy corrected by nitrogen. *Source: (de Blas et al., 2019).
![]()
Although a statistical analysis was not carried out due to the few samples analyzed, there were no significant differences between cultivars nor between campaigns.
The parameters that were most affected by the cultivar, and also by the campaign, were those related to fiber. Including: CF, NDF and ADF. While significant differences in regards to EE, were only observed between campaigns, but this did not affect CE values.
Effect of microwave deactivation
Table 2 shows the results of pea deactivation through the use of microwaves.
.
Table 2. Effect of microwave pea deactivation on chemical parameters.*Data standardized to 88% DM. MS: Dry matter;CP, Crude protein; UA, Urease activity; SP, KOH soluble protein 0.2%; ADIN: Acid detergent insoluble nitrogen. Means with different superscript differ statistically (p≤0.05).
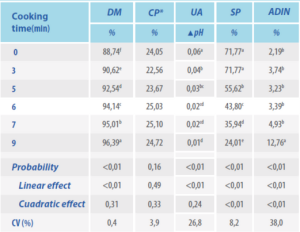
As the cooking time increased, and as it was expected, the humidity of the sample decreased, leading to a linear increase in the DM percentage(p≤0.05). Whereas, the percentage of protein standardized to 88% DM was not affected by the cooking time (p>0.05).
In regards to urease activity, a linear effect was found due to cooking time (p≤0.05). This also occurred for SP in KOH.
However, in this last parameter a quadratic effect was also found (p≤0.05), possibly due to the lack of differences between 0 and 3 min of cooking (p>0.05). While, with 5 min, this value decreased significantly (p≤0.05), and continued to do so for each time it was evaluated (6, 7 and 9 min).
In the case of ADIN, there was a quadratic response (p≤0.05), but this parameter was less sensitive,as a significant difference was only found after 9 min of cooking (p≤0.05).
In Table 3 you can find the energy values according to the different cooking times.
Energy Parameters
Table 3.Effects of microwave deactivation of peas on energy parameters.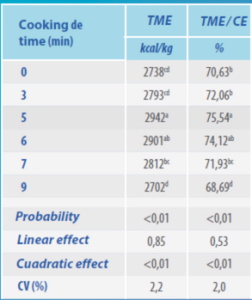 Table 3. Effect of deactivating peas with microwaves on energy parameters. Data standardized to 88% of DM. TME: True metabolizable energy; GE: Gross energy. 9 Means with different superscripts, differ statistically (p≤0.05).

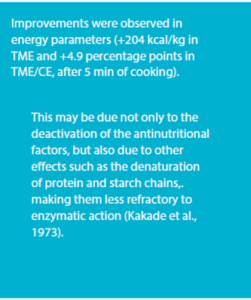
Regarding the energy analysis, as the cooking time increased, the sample’s TME increased significantly (p≤0.05), reaching a maximum at 5 min of cooking time (+204 kcal / kg with respect to crude oil)/ Similar to what happens with the use of GE (TME / GE), which evidenced a clear quadratic response for these parameters (p≤0, 05, Table 3 and Figure 1).
![]()
A similar situation was observed with soybeans, but the time needed to achieve optimal microwave deactivation was 6 min (Chale et al., 2017).
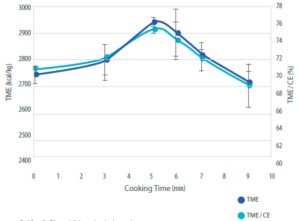
Figure 1. Effect of microwave pea deactivation on true ME and gross energy utilization.
Conclusions
Nutritional characterization of peas
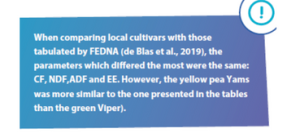
No major differences were found between pea cultivars, nor between crop campaigns (2019 and 2020). The parameters that varied the most were CF, NDF and ADF.
Effects of microwave deactivation
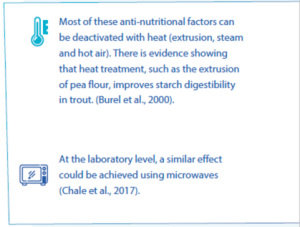
Although peas have low levels of antinutritional factors, a beneficial effect was found when applying a thermal process using microwaves. It was established that the best results for TME and GE use, were achieved with a cooking time of 5 min at 70% power in a microwave of 900 watts.