If we used the equation suggested by WPSA (1989), the SBM from USA would be penalized since the potential for increased digestibility of the protein fraction and the higher sugar content in SBM would not be considered (Mateos et al., 2019).
 28 May 2020
There are variations in the estimates of the energy value of soybean meal due to factors such as the variations in composition of the ingredient, the methods used to analyse it, as well as the models used to estimate AMEn. This article anlayses the limitations of the models currently in use and proposes a more representative model.
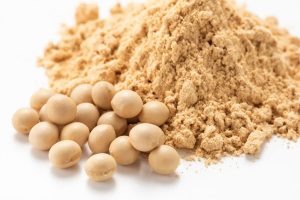
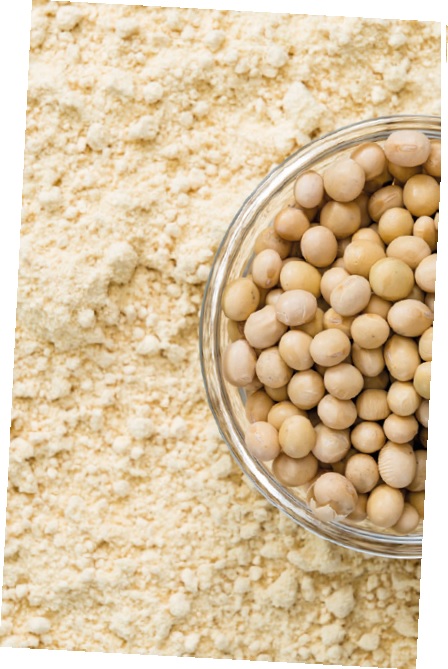
Soybean meal (SBM) is the main protein source in diets of monogastric animals worldwide. It also provides a considerable energy value in standard broiler diets (Mateos et al., 2019), accounting for up to 18% of total energy required by the bird.
The energy content of soybean meal mainly depends on:

Many research institutions investigating the nutritional composition of raw materials (Table 1) have reported values of apparent metabolizable energy corrected for nitrogen (AMEn) for soybean meal (47% CP). AMEn values vary between 2,180 and 2,360 kcal/kg (Table 2).


Although the research institutions cited in Table 2 consider SBM nutritional value to be constant, it actually can vary based on a number of factors, such as:
Prediction equations to determine Soybean meal energy value have been developed. However, it is important to consider that SBM chemical composition varies between research institutions.
Consequently, the results of these equations are affected by the values used by each research institution.
The list of equations used to estimate AMEn values in poultry production includes the one published by WPSA in 1989 (European Table of Energy Values for Poultry Feedstuffs). García-Rebollar et al. (2016) observed that this methodology is mainly based on the energy contribution of:
… without taking into consideration:

The present article presents a comparison between the AMEn values reported by different research institutions (Table 3). They were estimated using three prediction equations for SBM energy value in poultry production (particularly roosters), recommended by WPSA (1989) and CVB (2018).

For calculation of AMEn values, the estimated ratio between EE and EEHA (0.59) was based on the data published by CVB (2018).


Prediction equations are useful tools to examine AMEn values in poultry production. However, such equations are general and do not consider factors that could affect the nutritional value and the quality of soybean meal. This may result in possible overestimation or underestimation of its energy content (Serrano et al., 2012; Mateos et al., 2019).
A potential problem when it comes to calculating the energy value using these equations is that the method used to analyze the main components can affect the estimates. For example, the EE content can vary according to the method of processing, showing a higher value for SBM when a prior acid hydrolysis is used.
Consequently, the energy coming from the lipid fraction of SBM can be different between samples, even when SBM has the same protein and EE contents.
A further observation is that the WPSA equation, which is widely used to estimate AMEn in poultry production, is 32 years old, and it may not be as precise as currently required (Mateos et al., 2019). This equation uses the nitrogen-free extract (NFE) as a main variable to estimate the energy content. This variable does not have a clear meaning, since it is calculated as the difference between 1,000 and the proximal content of the analysis.
Ravindran et al. (2014) and Lagos & Stein (2017) observed a higher CP digestibility and higher sucrose content for the SBM from USA, compared to SBM from Brazil (BRA), Argentina (ARG) and India.
If we used the equation suggested by WPSA (1989), the SBM from USA would be penalized since the potential for increased digestibility of the protein fraction and the higher sugar content in SBM would not be considered (Mateos et al., 2019).
Another possible energy contribution that is not estimated by this equation is the content of oligosaccharides (mainly estachiose). Although it is considered as an antinutritional factor and cannot be digested by monogastric animals, it can provide an extra energy contribution (especially in adult animals) through fermentation (Coon et al., 1990).
García-Rebollar et al. (2016) reported a higher content of oligosaccharides in SBM from USA, compared to the values observed in SBM from BRA and ARG.
Due to the variations in SBM energy content reported in different studies (García-Rebollar et al., 2016; Mateos et al., 2019), further work is required to develop a model or equation for energy estimation in SBM. This will allow to have a clearer and less variable estimate of the AMEn content in this ingredient.
Currently, a model is sought in which the contributions of AMEn (kcal/kg) by each of the nutritional fractions of SBM are considered. For example, the protein, fat, fiber (CF, NDF and soluble fiber), sugars, and oligosaccharides fractions.
It is also important to mention that, according to the method used to determine EE content, differences in the results for fat fraction may exist (NRC, 2012). Therefore, in the model to be developed, it is suggested to use only EE after acid hydrolysis (HCl)

References are available on request
This article was originally published in nutriNews Spain, under the title Variación en la estimación energética de la harina de soja


Subscribe now to the technical magazine of animal nutrition
AUTHORS
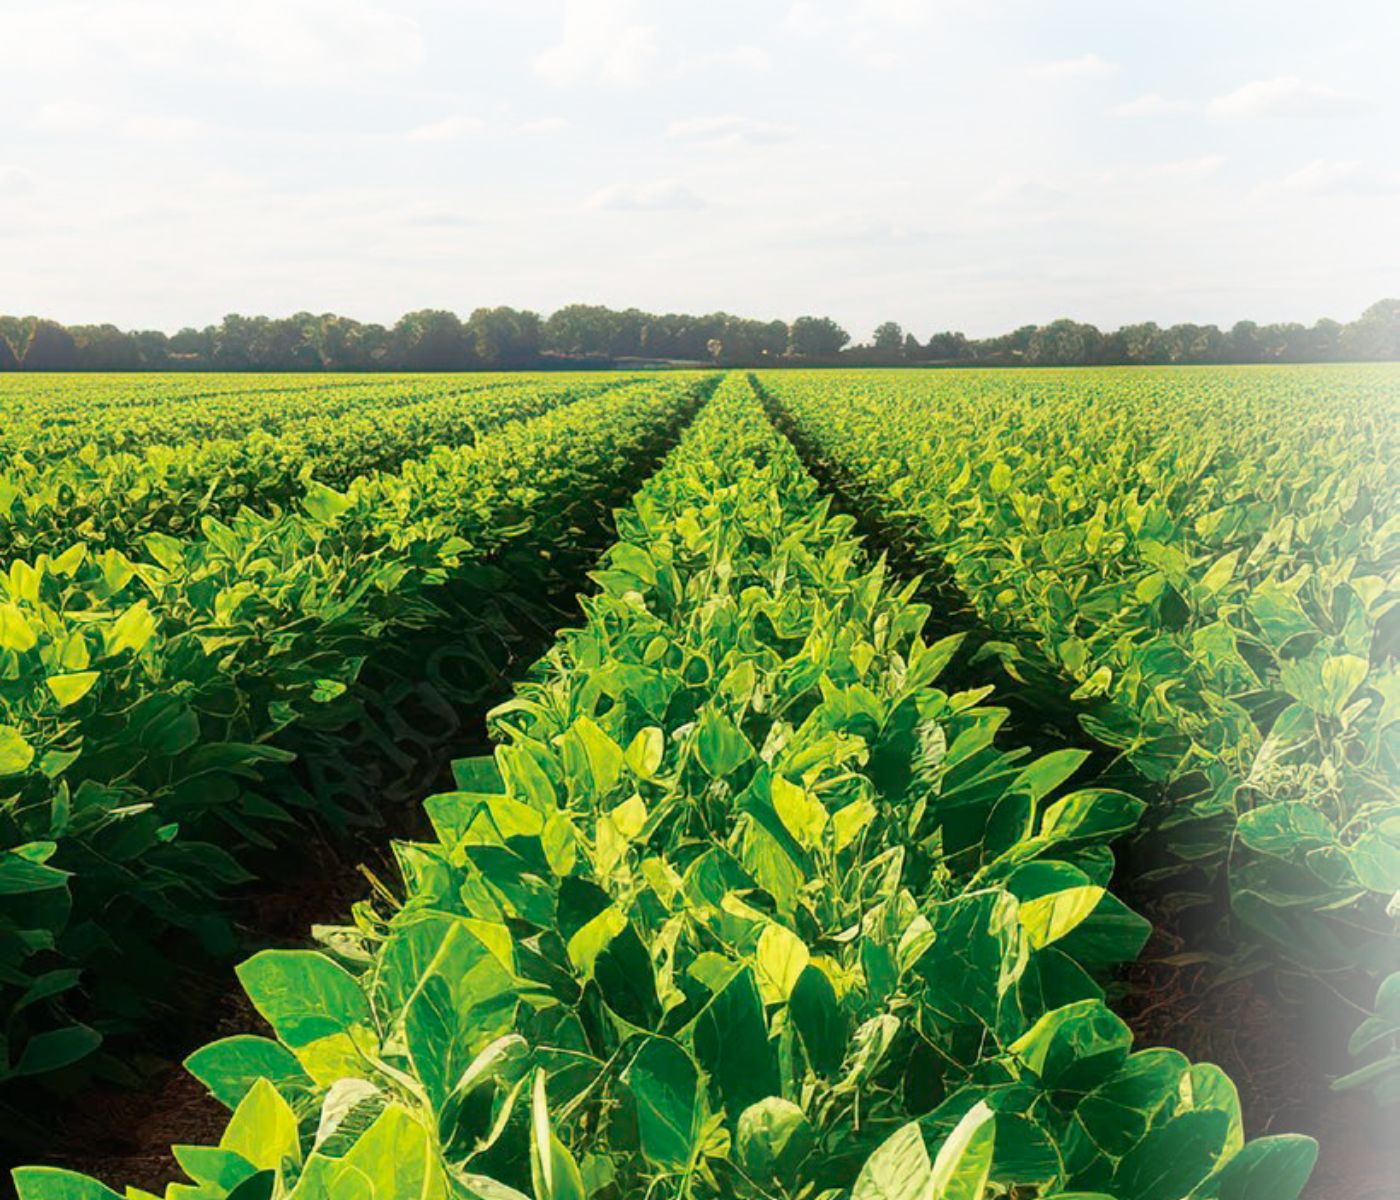
Consistency in Soybean Meal Drives Performance and Sustainability
Anna Cotcho
Kolin Plus FC: greener choline nutrition for poultry

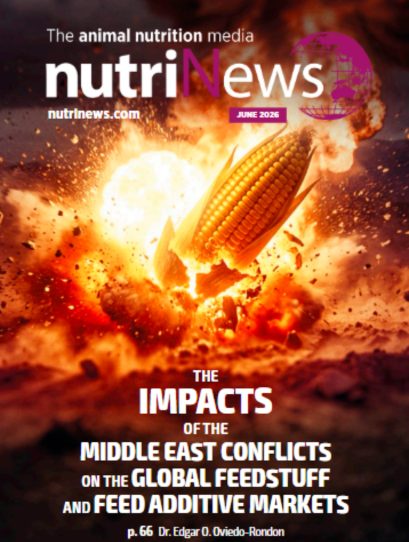
Middle East conflicts disrupt global feed markets
Edgar Oviedo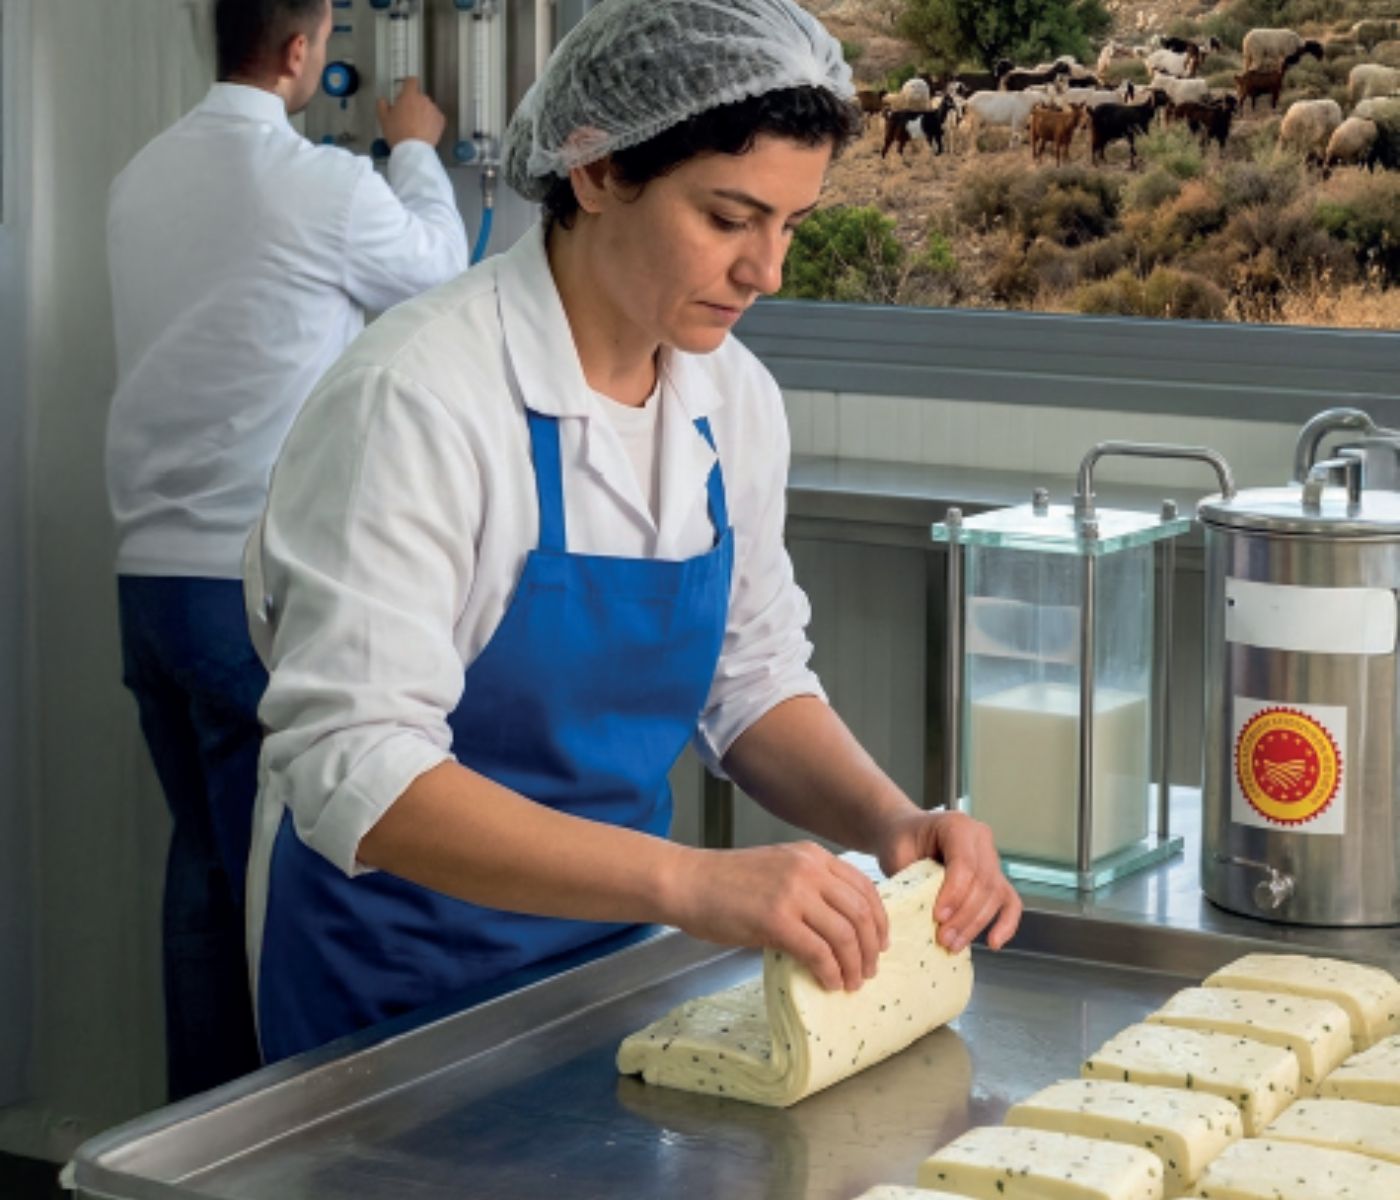
Optimizing nutrition for dairy goat and sheep productivity in Cyprus
Carolina Kyriacou
pHix-up improves rumen stability in dairy cows
Subacute ruminal acidosis
Net energy and growth: keys to better prediction in swine production
Gabriela Martínez
How starch structure & protein reduction shape gut health in weaned pigs
Diana Luise
Astaxanthin supplementation in aquaculture
Babatunde Saliu
What is intestinal health?
Marcos Rostagno
Calcium, phosphorus, and phytase optimization in broiler diets
Anna Cotcho