Mycotoxin evaluation is frequent in feed mills for grain sources like corn, wheat, and barley or products like peanuts and cottonseed. However, soybean meal, the most common protein source in feed for all animal species, needs more attention in this critical quality aspect. Several studies have indicated that soybean meal appears to be less susceptible to mycotoxin contamination than most grains. However, significant differences can be observed in contamination with mycotoxins among sources of soybean meal.
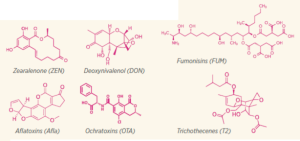
Previous literature reports have indicated that Zearalenone (ZEN), Deoxynivalenol (DON), Fumonisins (FUM), Aflatoxins (Afla), Ochratoxins (OTA), and Trichothecenes (T2) can be the main mycotoxins eventually observed in soybean meals. However, several publications suggest some variability per region. That effect should be clarified to determine if contamination relates to the location where samples were collected or the origin of production and manage risks according to these factors.
Global evaluations of samples are necessary since soybean meals have considerable trade worldwide. Relevant differences in nutrient and processing quality have been reported among countries of origin. The data reported here also indicate differences among sources of soybean meal on mycotoxin contamination.
Description of this worldwide mycotoxin survey
The data on mycotoxin levels in soybean meal presented in this article are part of the dsm-firmenich World Mycotoxin Survey. Starting in 2004, it is the longest-running and most comprehensive data set on mycotoxin occurrence and allows studying variations in mycotoxin occurrence worldwide. Dsm-firmenich offers mycotoxin analysis to customers as a service to identify mycotoxin risk in their raw commodities and final feeds. The increasing sample size over the years gives detailed insights into the incidence of the six major mycotoxins in the agricultural commodities used for livestock feed. This information aids in identifying the potential risks posed to livestock animal production per region or in imported feed ingredients.
Most results included in the survey are obtained using methods like ELISA, HPLC, or state-of-the-art LC-MS/MS-based multi-mycotoxin methods. Samples that tested positive for one of the main mycotoxins are also presented as the percentage of contaminated samples. The average and median of positives are calculated in ppb of all positively tested samples. The maximum levels are also described. Such high levels are seldom observed, but still, they occur and underline the importance of testing for mycotoxin occurrence.

 China, the United States, Brazil, Argentina, and India are leading soybean meal producers. The 27 European Union countries may produce more soybean meal together than India, but not as individual countries. Considering the production volume of soybean meal and the data in the dsm-firmenich World Mycotoxin Survey that can track the origin of the soybean meal, we looked at the results of soybean meal samples from China, USA, Brazil, Argentina, and India analyzed from June 2022 to June 2023.

Results of the mycotoxin survey
The results of this study are summarized in the following Table and the prevalence of each mycotoxin per country in the Figures.
The contamination levels of all soybean samples worldwide are always lower than reported in grains, confirming what scientific papers have indicated. However, they are present in this feedstuff and may occasionally contribute to total feed contamination. It is evident that the differences among soybean meal-producing countries on types of mycotoxins and levels of contamination observed.
The most significant number of samples evaluated were from Argentina and Brazil, and the lowest was from India. Variability in the number of samples per country corresponds to all samples received from each origin for mycotoxin screening this year. The most frequent mycotoxins observed were ZEN, FUM, and DON. They indicated contamination with Fusarium molds is the most common in soybean meals worldwide.
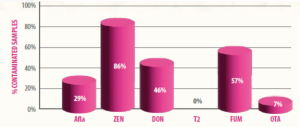
Figure 1. Prevalence of mycotoxins detected in soybean meal samples from China
In China (Figure 1-A), Argentina (Figure 1-D), and India (Figure 1-E), 86 or 82% of the samples were positive for ZEN; however, in India, 97% of the samples analyzed were positive for OTA and 92% positive for T2 (Figure 1-E).
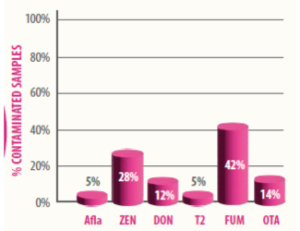
Figure 2. Prevalence of mycotoxins detected in soybean meal samples
from the United States
United States soybean meal (Figure 1-B) had the lowest percentage of samples positive for ZEN (28%) among all five countries studied and the lowest average and median concentration (17 and 15 ppb) or maximum level (38 ppb) of ZEN. In all other countries, the ZEN levels observed were almost three times (2.3 to 3.6) higher. The highest levels of ZEN (Table 1) were observed in samples from Argentina and Brazil (1000 and 809 ppb).
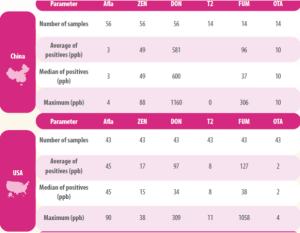
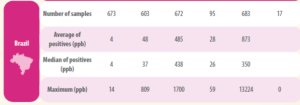
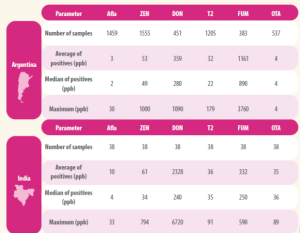
Table 1. Results of the dsm-firmenich World Mycotoxin Survey in soybean meal samples collected from June 2022 to June 2023 and classified by country of origin.
Aflatoxins were the second most common mycotoxin observed in Argentinian soybean meals, with 63% of the 1,459 samples evaluated being positive (919 samples). However, contamination levels were around 2-3 ppb in Argentinian soybeans, and similar levels were observed in the Chinese and Indian soybean meals, with 29 and 26% of the samples positive for Afla.
A few samples from Brazil (13 out of 673) and the USA (2 out of 43) had Afla (Figures 1-C and 1-B). However, the median concentration of Afla in Brazilian samples was 4 ppb. In comparison, the two USA samples reached a median of 45 ppb, which could be considered outliers and hard to observe again.
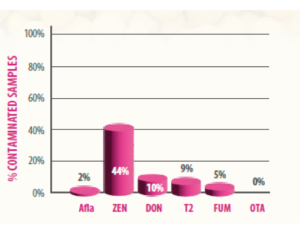
Figure 3. Prevalence of mycotoxins detected in soybean meal samples from Brazil
No samples of Brazilian soybean meal were positive for OTA (Figure 1-C), indicating low or no contamination with Penicillium molds in these samples. No T2 was observed in the Chinese samples (Figure 1-A), but 46% (26 out of 56) were positive for DON.
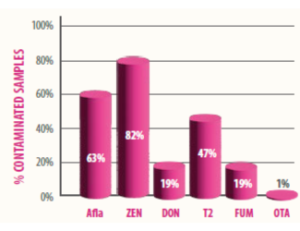
Figure 4. Prevalence of mycotoxins detected in soybean meal samples from Argentina
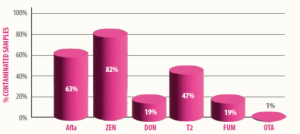
Figure 5. Prevalence of mycotoxins detected in soybean meal samples from India
The United States soybean meals positive for mycotoxins generally had the lowest average and median concentrations of DON, T2, FUM, and OTA observed worldwide (Table 1). Using only the median values of positive samples, the US soybean meal had 7.1 to 17.6 times less DON, 2.8 to 4.4 times less T2, 6.6 to 23.4 times less FUM, and 2.0 to 18.0 times less OTA than other countries. China and the USA soybean meals had similar number of samples positive for FUM (Figures 1-A and 1-B) and similar median concentrations (Table 1).
Conclusions
- Based on the median concentration of these mycotoxins and the number of positive samples within the survey, the United States soybean meal is currently the safest source to avoid multi-mycotoxin contamination. However, monitoring mycotoxins in all soybean meals every year is always advisable because concentrations of mycotoxins may occur due to annual weather fluctuations.
You may also like to read:“Advances in the use of soybean in animal nutrition”
